NFI-ODCE INDEX FOR PRIVATE REAL ESTATE
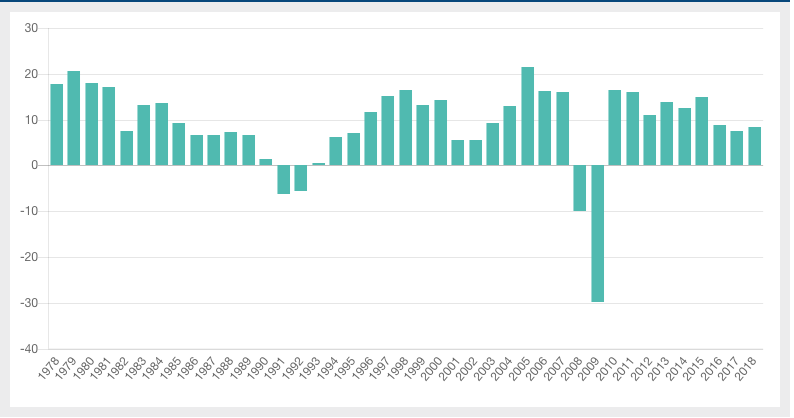
The National Council of Real Estate Investment Fiduciaries (NCREIF) Fund Index – Open End Diversified Core Equity, also known as the NFI-ODCE Index, is utilized as an institutional real estate performance benchmark. The NFI-ODCE Index is an index of investments returns (gross of fees) of the largest private real estate funds pursuing a core investment strategy which is typically characterized by low risk, low leverage (less than 40%), and stable properties diversified across the US.Below are the returns of the NFI-ODCE Index since its inception in 1978.
NFI-ODCE Index Annual Returns
| 1978 | 17.67% | 1999 | 13.17% |
| 1979 | 20.64% | 2000 | 14.28% |
| 1980 | 18.05% | 2001 | 5.63% |
| 1981 | 17.01% | 2002 | 5.54% |
| 1982 | 7.45% | 2003 | 9.28% |
| 1983 | 13.23% | 2004 | 13.07% |
| 1984 | 13.68% | 2005 | 21.40% |
| 1985 | 9.36% | 2006 | 16.32% |
| 1986 | 6.74% | 2007 | 15.96% |
| 1987 | 6.74% | 2008 | -10.00% |
| 1988 | 7.32% | 2009 | -29.76% |
| 1989 | 6.72% | 2010 | 16.36% |
| 1990 | 1.42% | 2011 | 15.99% |
| 1991 | -6.25% | 2012 | 10.94% |
| 1992 | -5.50% | 2013 | 13.94% |
| 1993 | 0.55% | 2014 | 12.49% |
| 1994 | 6.14% | 2015 | 15.01% |
| 1995 | 7.11% | 2016 | 8.76% |
| 1996 | 11.70% | 2017 | 7.61% |
| 1997 | 15.10% | 2018 | 8.35% |
| 1998 | 16.41% |
NFI-ODCE Index Annual Returns (%)
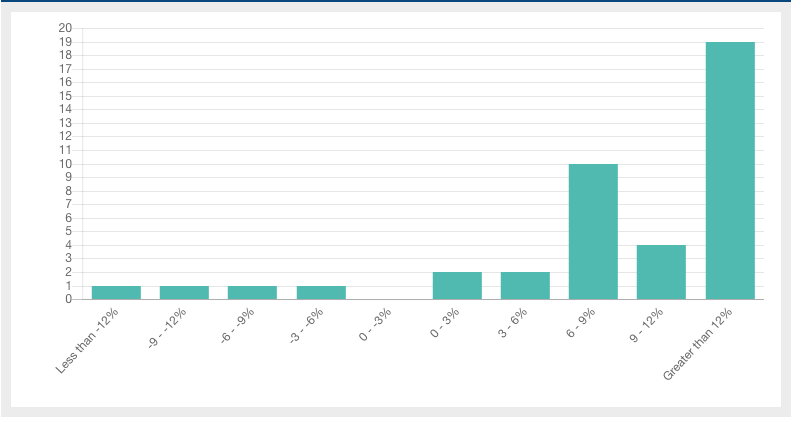
Distribution of NFI-ODCE Index Annual Returns (1978–2018)